Obsah článku
Monitoring competition is a useful way to get an overview of market development. Several tools are available to provide you with valuable data. The better ones are mostly paid, but even the free ones are not that bad.
In this article, I will show you the data provided by Google Ads in the Auction Insight Report. Let me explain what each piece of data means and how you can visualize it.
CHECK THIS REPORT IN GOOGLE DATA STUDIO
Google Ads – Auction Insight
You can use the Auction Insight Report to compare performance with advertisers participating in the same auctions. You can also use this data to identify opportunities for improving your campaign performance.
The report contains 6 metrics:
- Impression Share
- Overlap Rate
- Position Above Rate (Search campaigns only)
- Top of Page Rate (Search campaigns only)
- Absolute Top of the Page Rate (Search campaigns only)
- Outranking Share
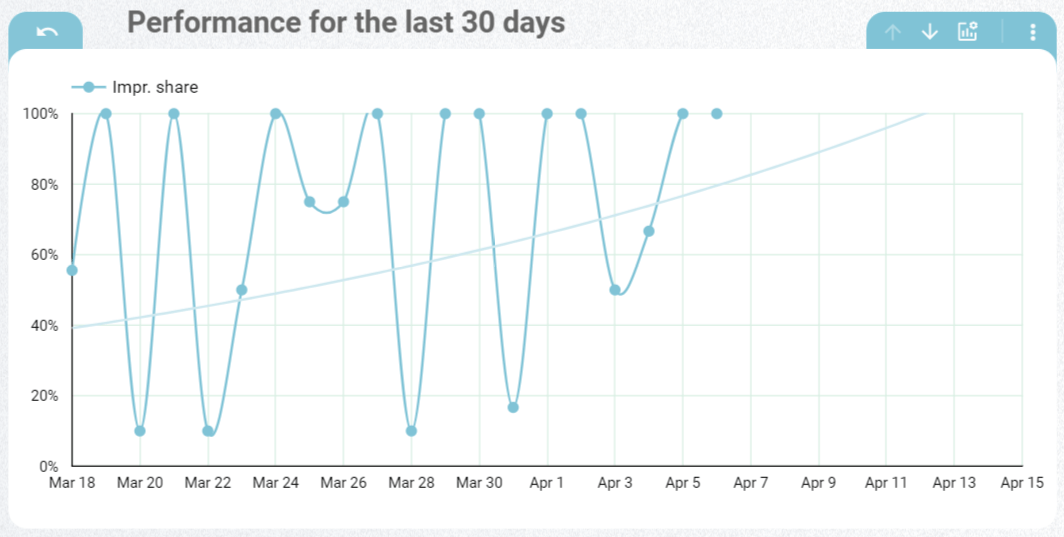
The Impression Share is the percentage of impressions your ads receive, out of the total impressions they could receive.
| Impression share = impressions / total supported impressions |
In other words, if your impression share is 45%, it means your ad was shown in 45 cases out of 100 that it could have been shown.
Related metrics
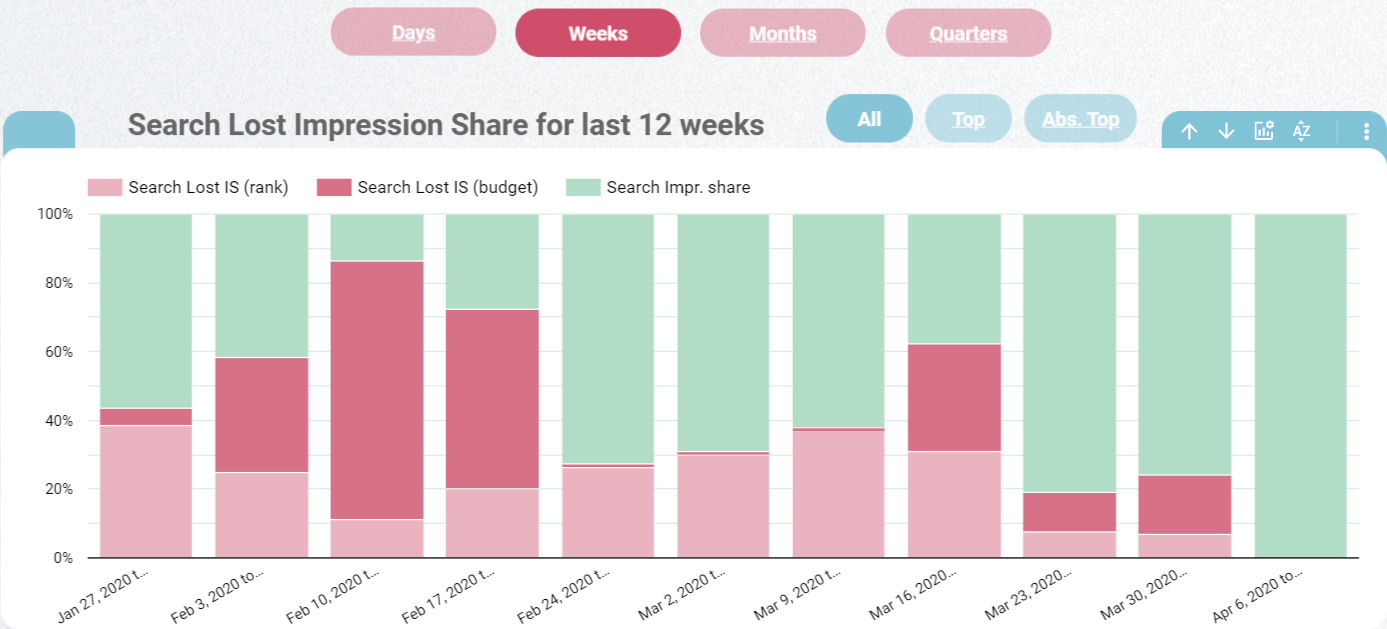
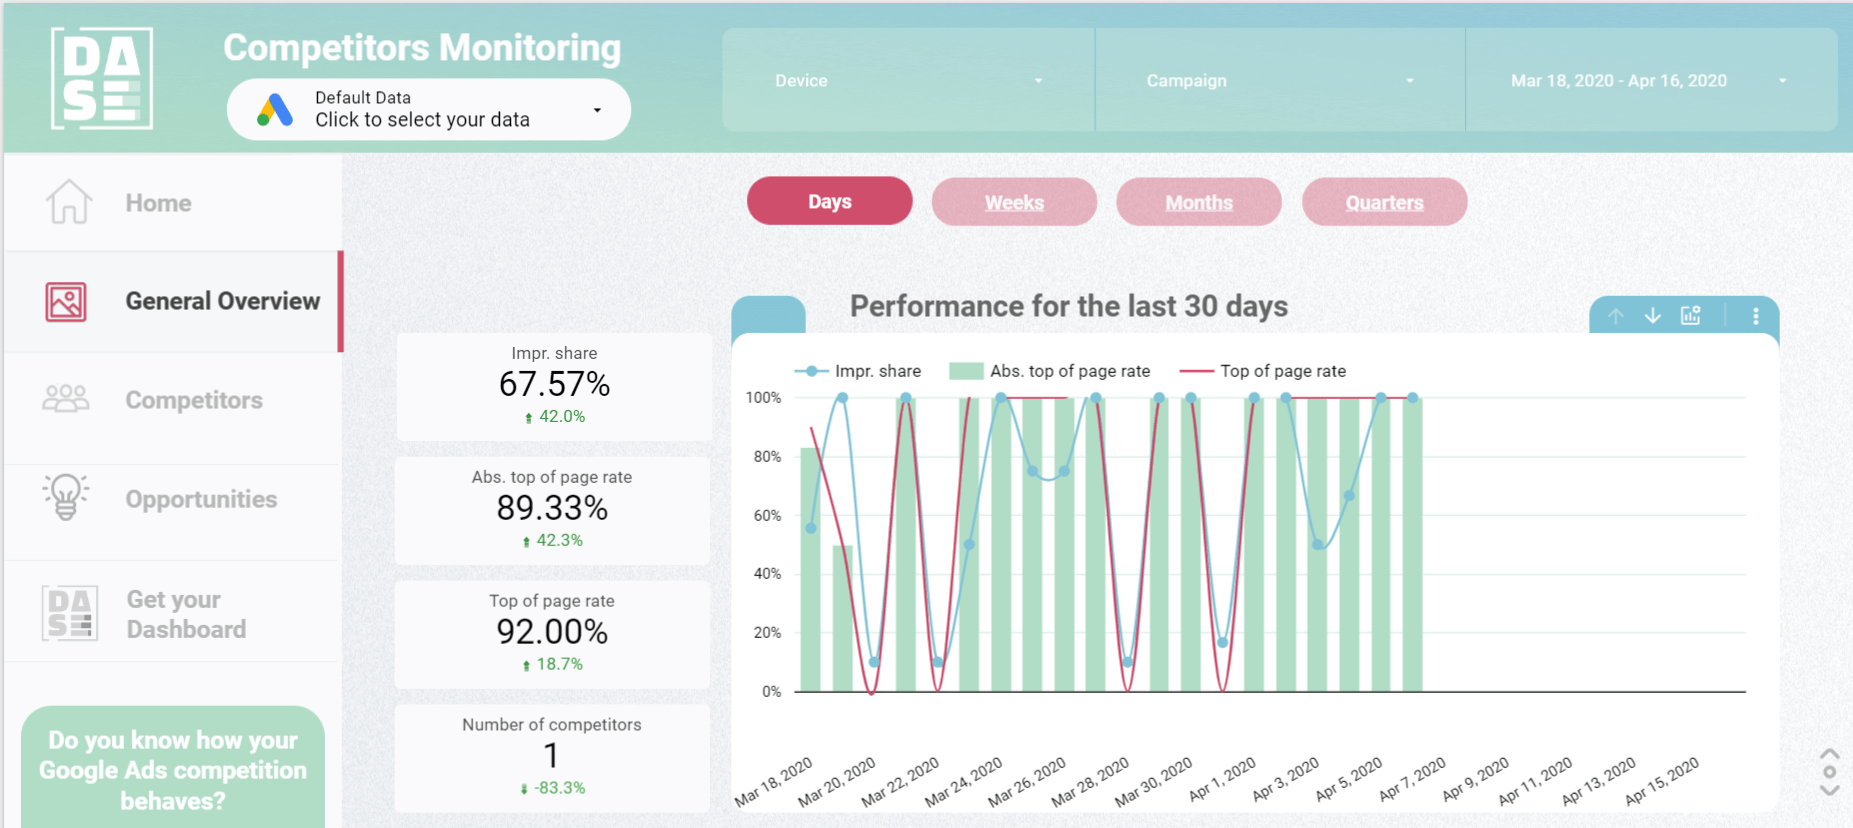
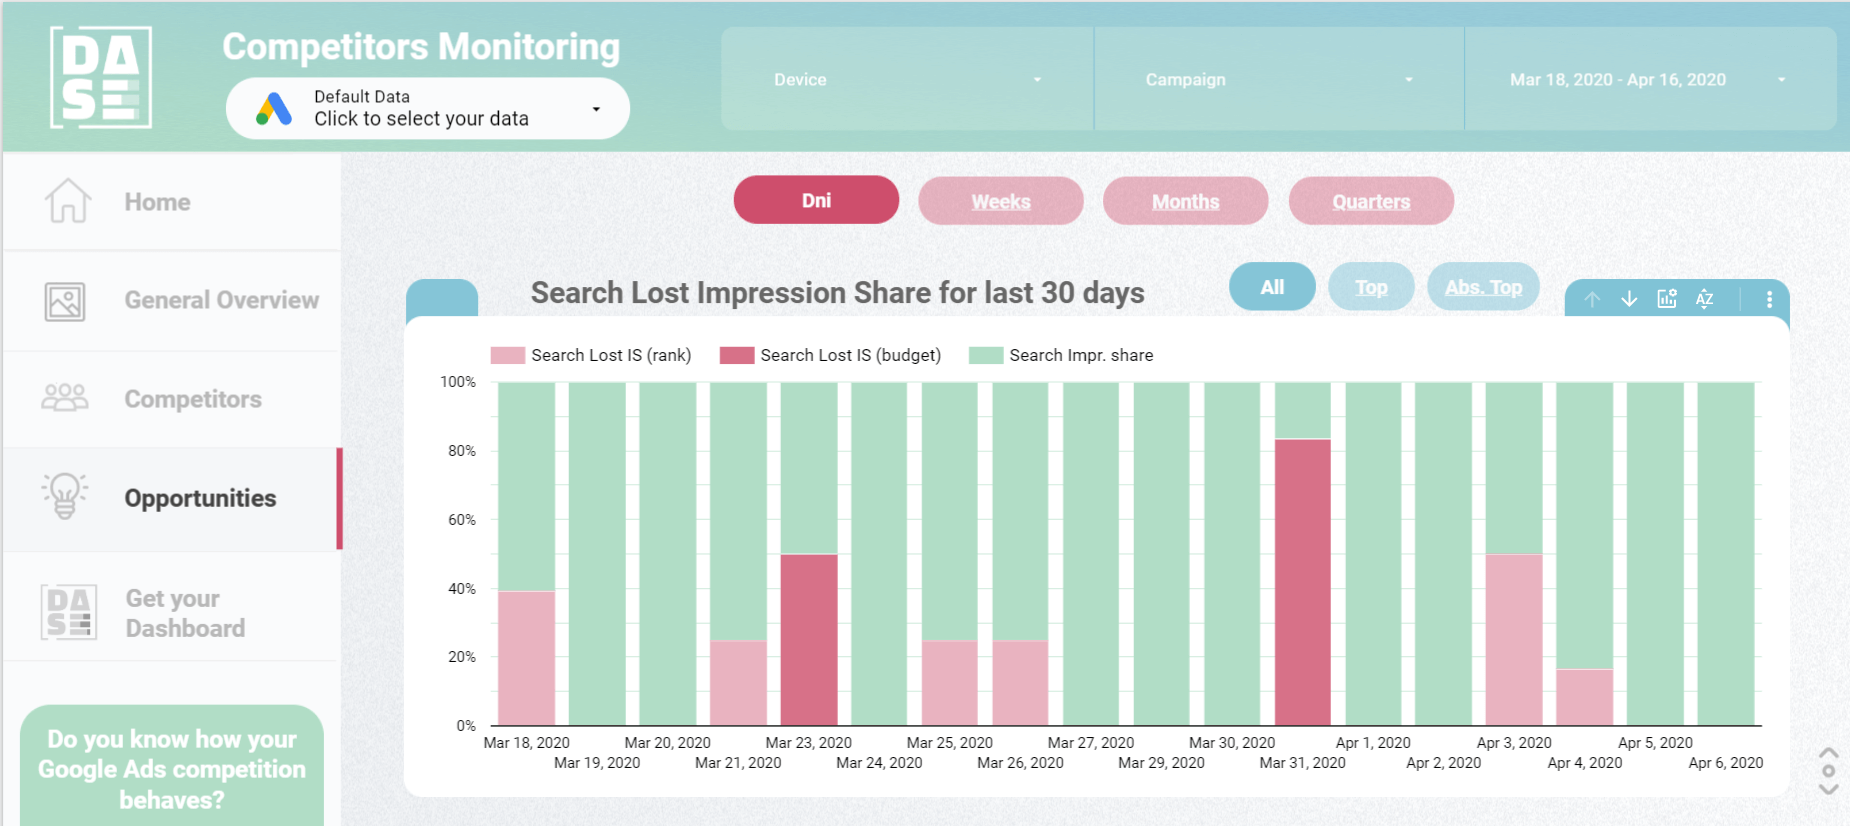
The Impression Share should be combined with the Search Lost Impression Share (budget), or the Display Lost Impression Share (budget). This way you can identify when your ad doesn´t show due to the low budget.
The Search Lost Impression Share (rank) or the Display Lost Impression Share (rank) will tell you if your ad quality is getting better or worse.
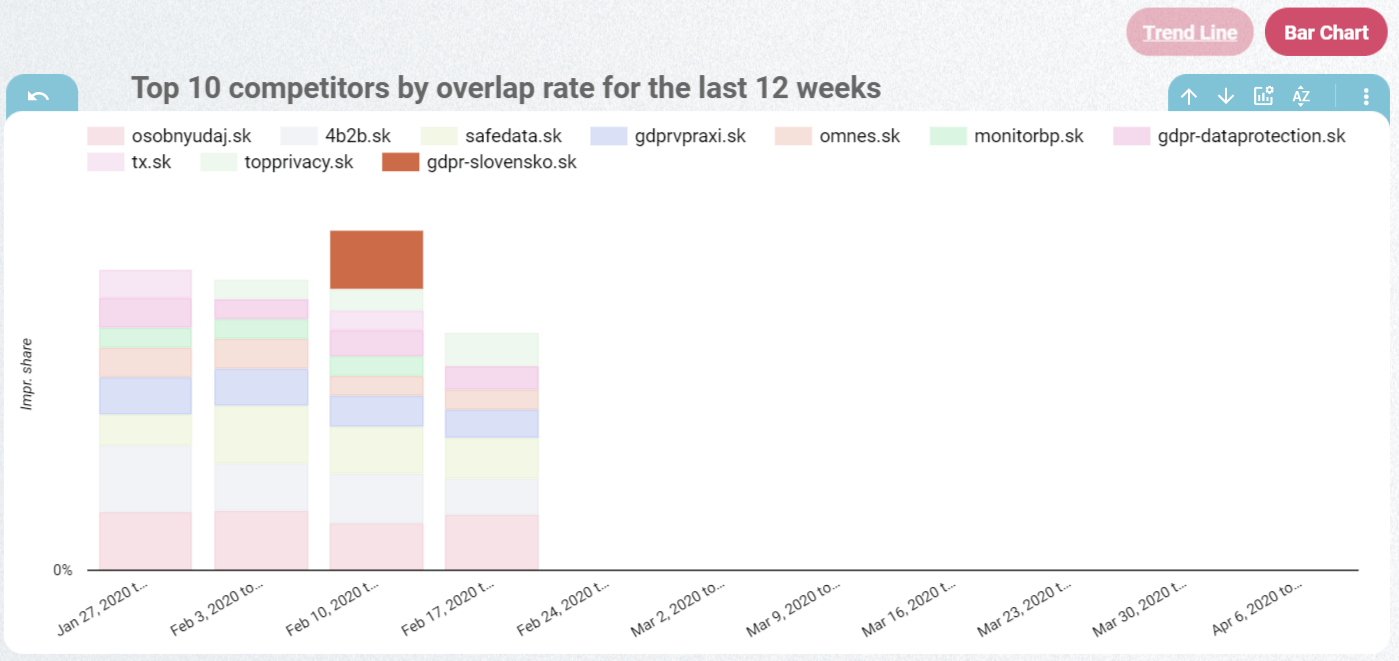
Overlap Rate
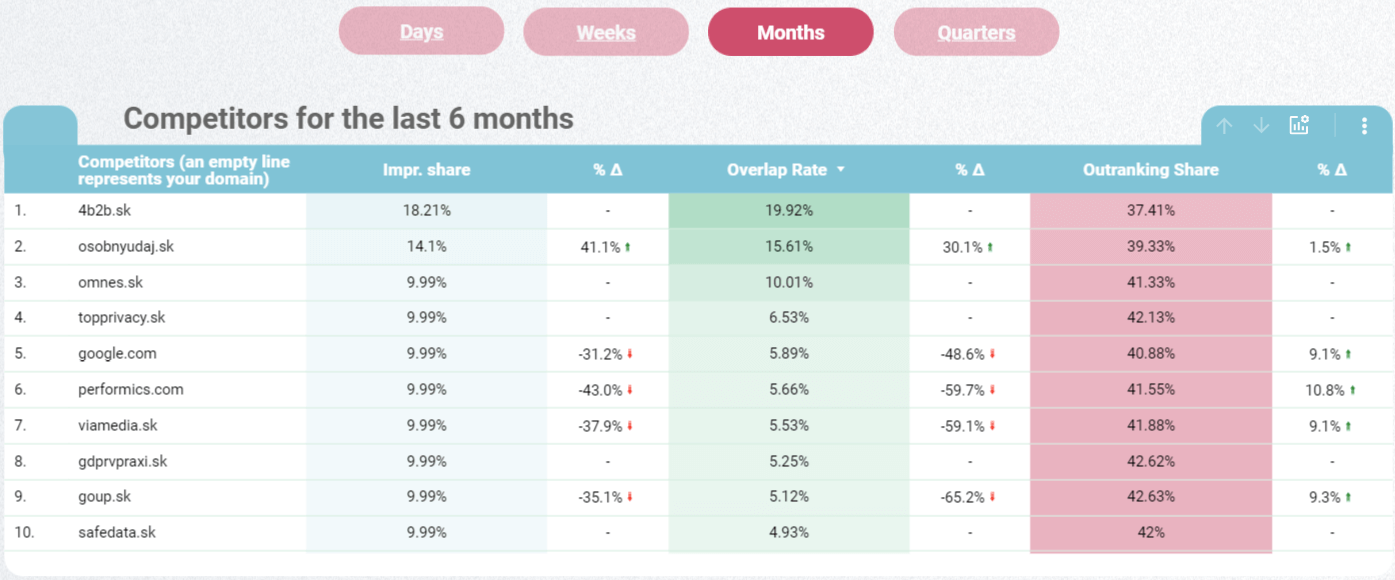
The Overlap Rate tells you how often another publisher’s ad received an impression when your ad also received an impression. So if its value is 50%, for example, it means that in 5 out of 10 cases, both your ad and the competitor’s ad appeared at the same time.
It is an indicator of how much your companies are competing with each other and how many products or keywords they’re targeting are similar to yours.
By using a campaign-level filter and choosing your brand campaign, you can identify competitors advertising on your brand. This way, you can also see if your ad is shown together with relevant competition.
Position Above Rate
The Position Above Rate shows how often another publisher’s ad appeared in a higher position than your ad if both ads appeared at the same time.
In practice, this means that if a competitor’s metric value is 15%, then his ad was shown above your ad in 15 auctions out of the 100.
Unfortunately, this metric is not available in Google Data Studio when we publish this article and it can only be viewed in your Google Ads account.
Top of Page Rate
It shows how often your ad appears at the top of the page above organic search results. The higher this value is, the more often your ad is placed higher. For example, you have 200 impressions and the ad was placed 150 times above the organic results. In this case, the top of page rate would be 75%.
This metric will tell you how you are doing in improving your ad position.
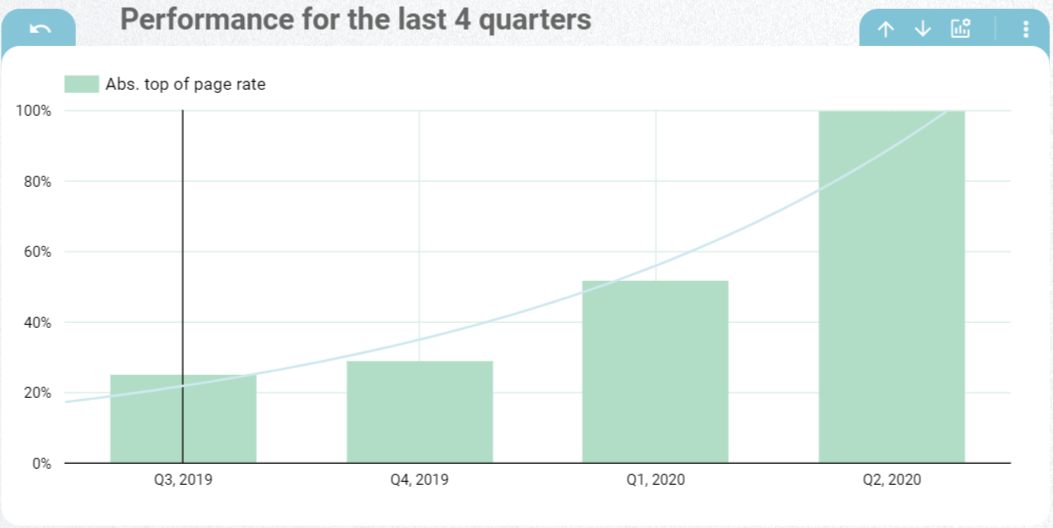
Absolute Top of Page Rate
The Absolute Top of Page Rate tells you how often your ad was ranked in the first position above the organic results.
I recommend tracking this metric for key products and services.
It’s a percentage that represents how many times your ad appeared higher than a competitor’s ad, plus all impressions when your competitor’s ad did not appear at all.
You can use this metric in combination with your Overlap Rate to see how you are performing above your competitors.
CHECK THIS REPORT IN GOOGLE DATA STUDIO
Visualization of competition behavior
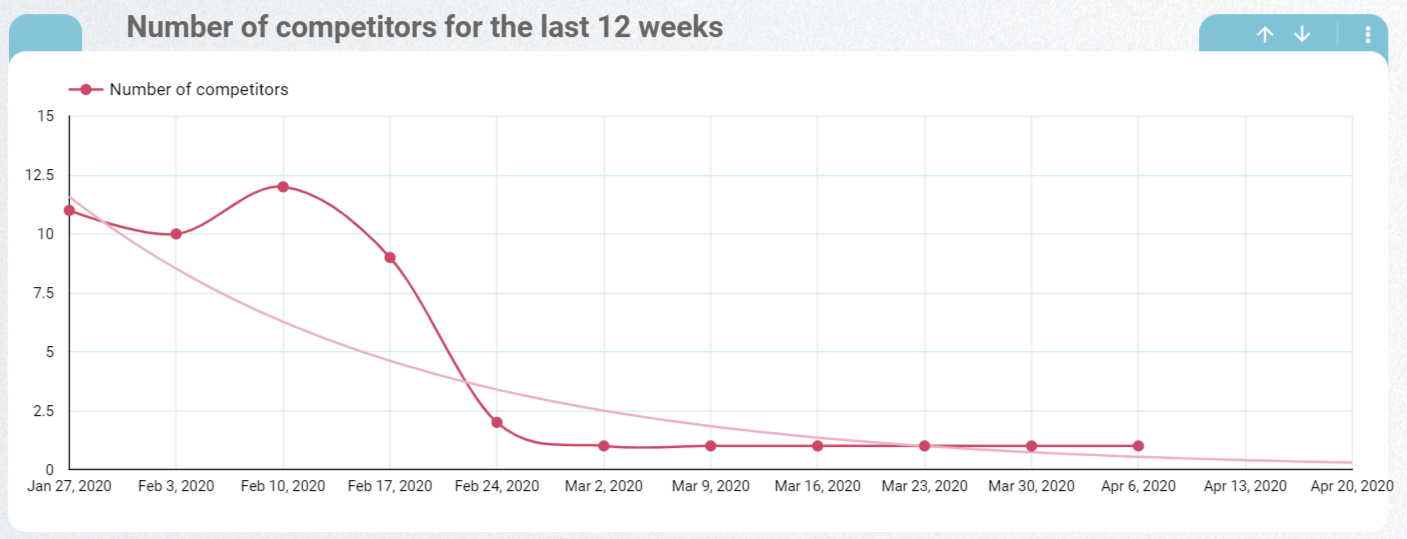
The number of competitors in time?
This report allows you to see how many competitors have participated in the auction during a specific period. When you apply a filter, you can see the number of competitors per specific campaign or device. This way, you can see how the number of your competitors in the auction is changing.
Do you have new competition?
This overview will help you to identify new market players or seasonal competitors. At the same time, you can see how they manage to show their ads on search.
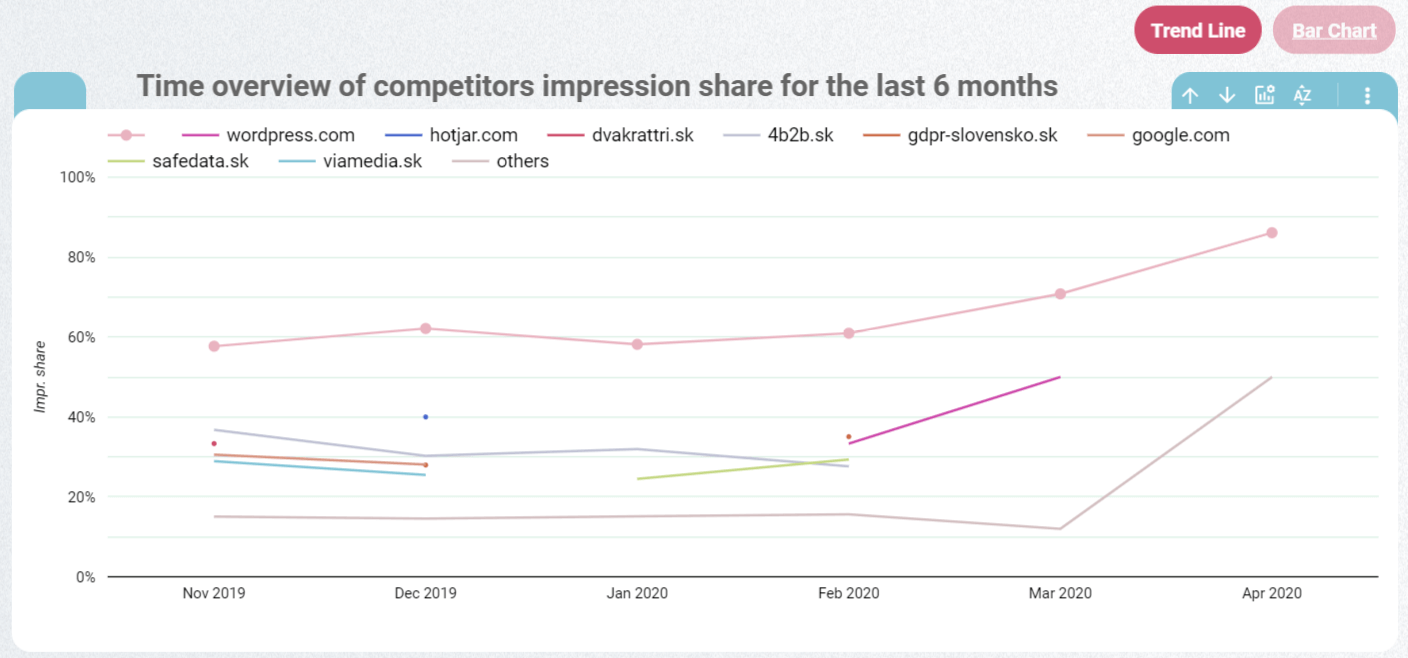
How does your competition behave?
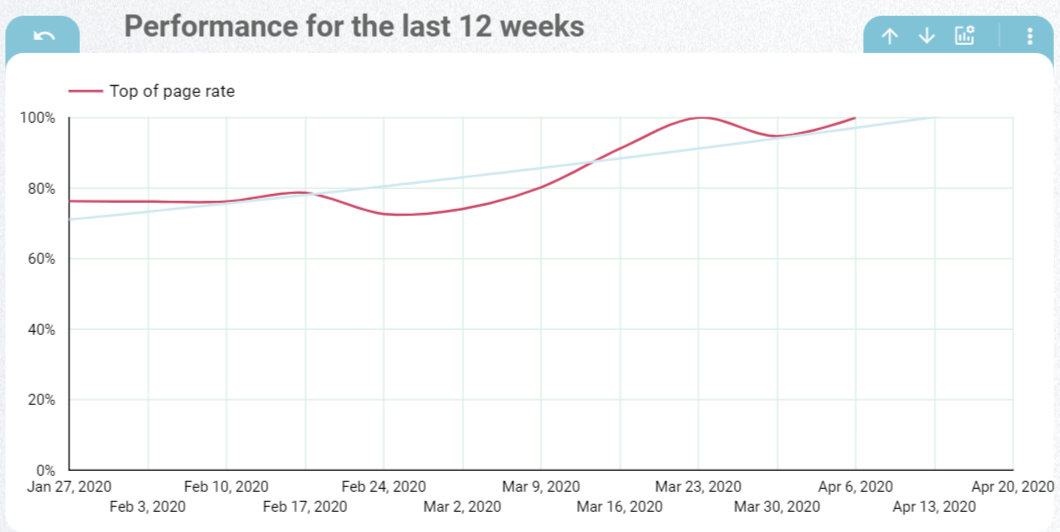
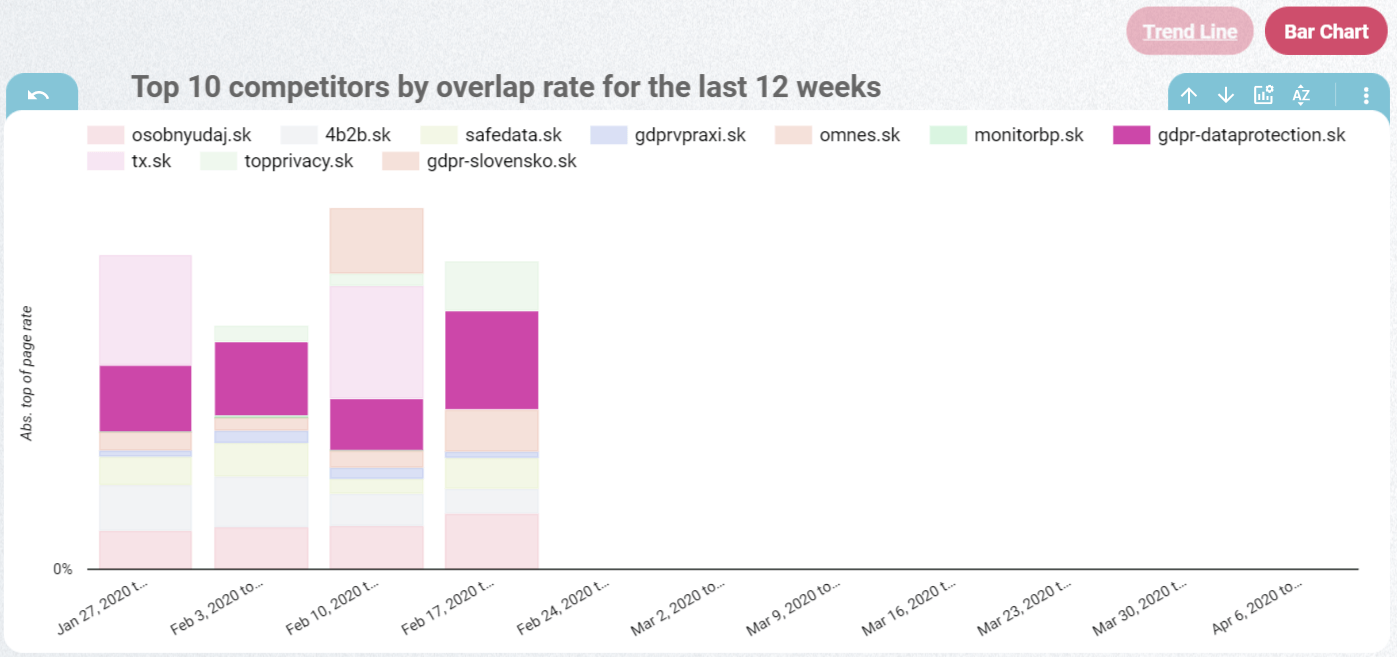
The Top of Page Impression Rate will partly help you to answer this question. See if your competitors have been increasing or decreasing in the last 12 weeks. If you are only interested in one competitor, you can simply select it and see only its results.
If you see that the Top of Page Impression Rate is increasing, it may be a signal that your ads are losing quality or that your competition is raising their bids.
Create a dashboard
To be well informed, I recommend using a dashboard to track your competition, where you can easily find the information we mentioned above.
To make the dashboard clear, it is good if it is divided into thematic units to help you to navigate and group related information.
Conclusion
Auction Insights is a great source of information about what and how your competition advertises on Google Ads. For the best usage of this information, I recommend segmenting it by device and campaign. It is different when your ad appears above organic results on mobile or desktop computers.
By adding information from other sources, such as social networks, you can monitor competitors’ behavior well and respond on time.
Do you have other ways to monitor your competition? I would be glad if you share them in the comments below the article.
Thank you for reading this article.
If you liked the article, you can share it with your colleagues and friends.


